A lot has been said before of the particular importance of the sixty foot time and how it impacts yout 1/4 mile ET. This can be clearly seen in the following analysis. ")
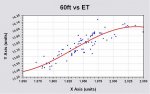
I took all the timeslips from this year's logs and plotted the 60 ft times vs. the 1/4 mile ET. The results were extremely evident. In the simplest of analysis, the slope of the linear relationship was 1:3.96! In other words every 1 tenth of a second in the sixty foot was equivalent to 4 tenths of a second in the 1/4 mile ET.
I have previously heard of 2 to 3 tenths in the 1/4 mile for every tenth in the sixty foot and was suprised it was actually almost 4 tenths. The average deviation was about 0.07 which meant the average tenth in the sixty foot was equivalent to 3.3 to 4.7 tenths in the ET.
The most close fitting curve to the plotted results was a sinsusoidal fit defined as y=a+b*cos(c*x+d). In layman terms that simply implies the curve tapers off at each end rather than a linear slope extending infinitely above and below the plotted range of data.
The data is shown in the attached graph. Your results may vary.