I know we have beaten this to death on another thread.
I thought I'd show some testing that I did with my speaker using a sound level meter, software, and some pink noise, for anyone that might be interested.
The meter was set to measure 1/3 octaves (1 octave = a doubling of frequency).
My speakers have 5 drivers and 2 ports. The subwoofer and it's port are separated from
the rest of the enclosure. There are 3 drivers on the top, a tweeter, midrange and mid bass.
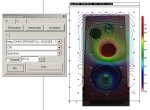
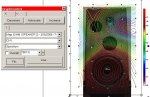
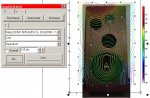
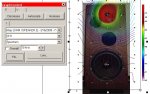
You can see at 315 Hz the sound coming from the top.
The front has the subwoofer, its port, the mid bass port, and another tweeter.
I measured the sound at each of the grid points marked on the speaker with peices of tape.
It would have been better if I used more points, but this was just a quick excersize in mapping.
The software lets you see each 1/3 octave by using the arrows in the graph control. The level is shown by color, red being the highest.
Here's a few screenshots at different frequencies:
I thought I'd show some testing that I did with my speaker using a sound level meter, software, and some pink noise, for anyone that might be interested.
The meter was set to measure 1/3 octaves (1 octave = a doubling of frequency).
My speakers have 5 drivers and 2 ports. The subwoofer and it's port are separated from
the rest of the enclosure. There are 3 drivers on the top, a tweeter, midrange and mid bass.
You can see at 315 Hz the sound coming from the top.
The front has the subwoofer, its port, the mid bass port, and another tweeter.
I measured the sound at each of the grid points marked on the speaker with peices of tape.
It would have been better if I used more points, but this was just a quick excersize in mapping.
The software lets you see each 1/3 octave by using the arrows in the graph control. The level is shown by color, red being the highest.
Here's a few screenshots at different frequencies: